How to Use Microsoft Clarity: The Ultimate SEO and UX Guide for Small & Medium Businesses
You’ve just launched a beautiful website, your Google Analytics shows decent traffic, but something’s off. Your bounce rate is sky-high, and visitors seem to vanish faster than free donuts at a Monday morning meeting. Sound familiar?
Here’s the thing: Traditional analytics tell you what happened, but they leave you guessing why it happened. That’s where Microsoft Clarity swoops in like a digital detective, revealing the mysteries behind your users’ behavior with crystal-clear insights.
What Is Microsoft Clarity? Your Free Website Detective
Microsoft Clarity catches user frustrations, missed opportunities, and conversion killers. This free website analytics tool provides behavioral insights that complement your existing analytics stack perfectly.
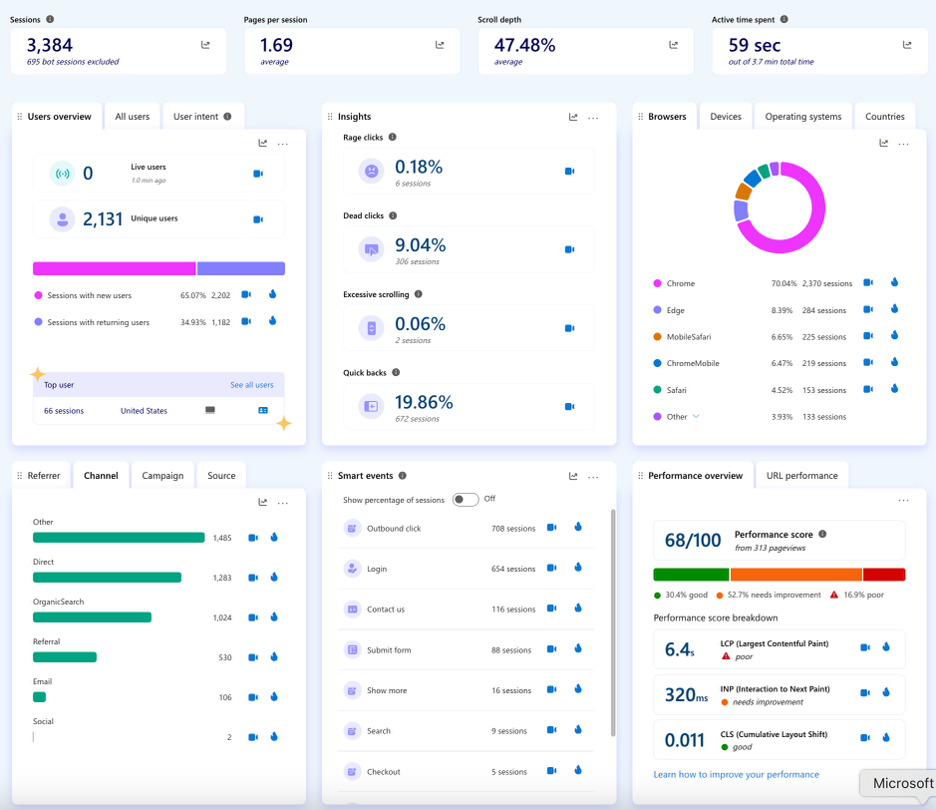
Clarity shows you what users do (not what they say they do) and helps you understand their digital body language through:
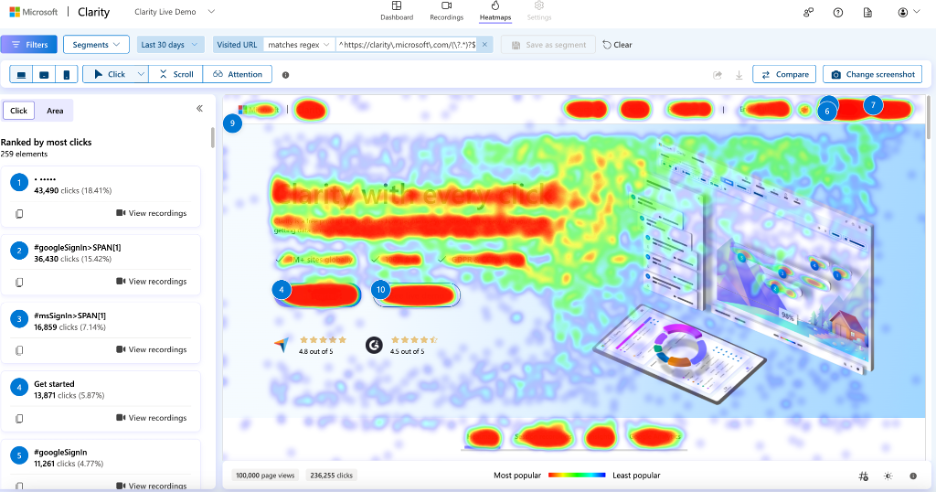
- Click heatmaps: Visual representations of where users click
Scroll heatmaps: Show how far down users scroll - Session recordings: Real-time playback of user sessions
- Behavioral signals: Detects rage clicks, dead clicks, and excessive scrolling
Learn more from the official Microsoft Clarity documentation.
The best part? It’s both free and GDPR compliant.
Why UX Is a Critical Part of SEO (And Why You Should Care)
Google’s algorithm now considers user experience signals as ranking factors, making UX (User Experience) optimization for SMBs essential for search visibility.
Google confirms that UX signals, such as Core Web Vitals, influence rankings—see Google Search Central’s UX guidance.
Here’s a real-world scenario that’ll make you rethink your approach:
Your Google Analytics shows an 85% bounce rate on your landing page. Ouch. But Clarity’s session recordings reveal something fascinating. Users are consistently missing your call-to-action because it’s positioned below the fold. Most visitors never scroll past your hero image.
Microsoft Clarity vs Google Analytics: GA4 shows you the numbers. Clarity shows you the story behind those numbers. Let’s take a look at how you can use Clarity to improve SEO and UX:
1. Analyze Heatmaps:
- Click Heatmaps: Understand where users are clicking (or not clicking) on key conversion pages (e.g., product pages, sign-up forms). If primary Calls-to-Action (CTAs) are ignored, consider repositioning or redesigning them.
- Scroll Heatmaps: See how far users scroll on conversion-focused content. If important information or CTAs are below the fold, where users tend to drop off, consider moving them higher on the page.
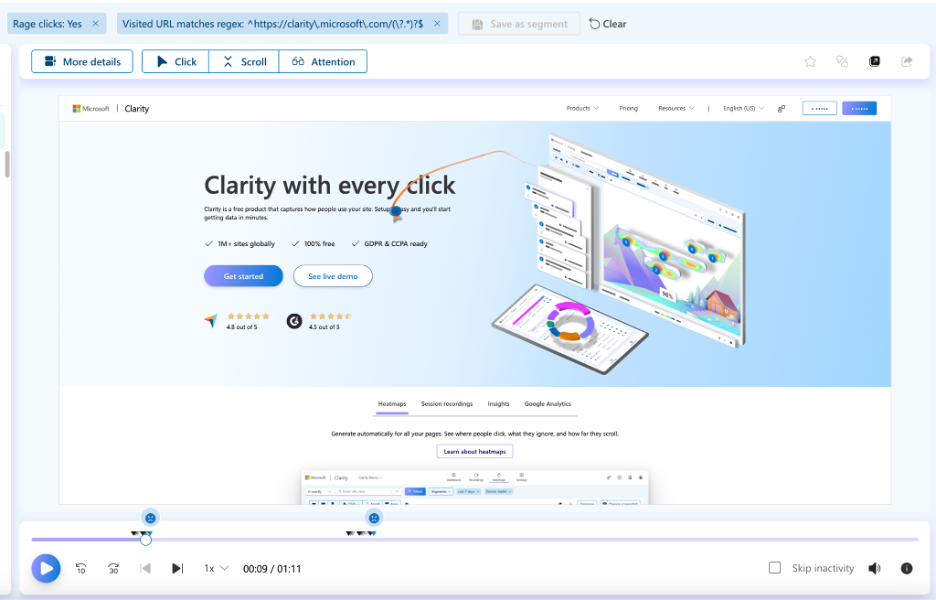
2. Watch Session Recordings:
- Identify Friction: Watch recordings of users who abandon forms, bounce from landing pages, or exhibit “rage clicks” (repeated, frustrated clicks). This helps pinpoint specific UX issues, such as confusing navigation, broken elements, or overwhelming layouts, that hinder conversions.
- Analyze Drop-Off Points: By observing short sessions or sessions with rage clicks, learn why users leave. This could reveal that users are missing a CTA, encountering technical glitches, or are confused by the content.
- Device-Specific Analysis: Filter recordings by device type. Identify mobile-specific pain points that affect conversion, such as difficult tap targets or unoptimized forms.
3. Optimize Conversion Paths:
- Address “Dead Clicks”: If heatmaps reveal clicks on non-clickable elements, make them clickable or redesign to avoid confusion.
- Simplify Forms: Session recordings expose friction points in forms (e.g., too many fields, unclear error messages). Streamline those to reduce abandonment rates.
- Improve CTA Visibility: Utilize heatmap and session recording insights to optimize CTA placement, wording, and visuals for improved clicks and conversions.
4. Integrate with Google Analytics 4 (GA4):
- Integrate Clarity with GA4 to segment specific traffic (e.g., organic traffic, mobile users). View session recordings for those segments. This allows for a deeper understanding of behavioral patterns among high-value user groups and provides context for GA4’s quantitative data (e.g., bounce rates, conversion rates).
- Use GA4 to track pre- and post-optimization data, comparing conversion rates to measure the impact of changes made based on Clarity insights.
5. Iterative Optimization:
- Deploy a continuous cycle of analysis, implementation, and tracking. After implementing changes based on Clarity data, revisit Clarity to monitor engagement metrics (bounce rates, time on page, scroll depth) to ensure the improvements are leading to higher conversion rates.
- Use Microsoft Clarity as a “website detective” to uncover the “why” behind conversion successes and failures, translating those behavioral insights into actions to improve the user experience and, ultimately, increase conversion rates.
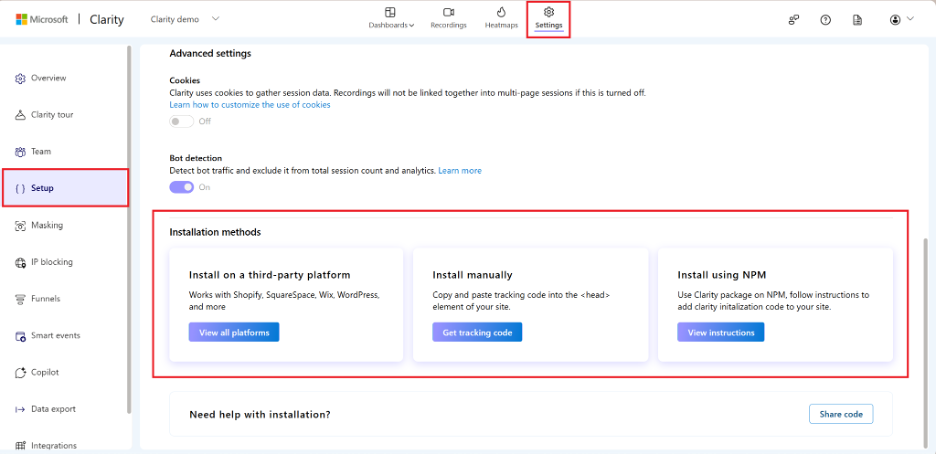
Microsoft Clarity Setup: Three Ways to Get Started
Setting up Microsoft Clarity for a small business is easier than assembling IKEA furniture (and way less frustrating). You have three main options:
Option 1: Direct HTML Installation
Copy the Clarity script and paste it into the <head> or <body> section of your website. Simple as Sunday morning pancakes.
Option 2: Google Tag Manager Integration
Add Clarity as a custom HTML tag through GTM. Perfect if you’re already managing other tracking codes this way.
Option 3: CMS Plugin Magic
WordPress, Wix, Joomla—there’s likely a plugin for your platform that makes installation a one-click wonder.
Pro tip: Integrate Clarity with Google Analytics 4 for deeper insights into specific traffic segments, such as organic or mobile users. See the Clarity GA integration docs.
Your Step-by-Step Microsoft Clarity Guide
Step 1: Prioritize Your Pages Like a Pro
Don’t try to analyze everything at once—you’ll get overwhelmed faster than a tourist in Times Square. Start with these high-impact pages:
- Recently optimized SEO pages: See if your changes improved engagement
- High-traffic landing pages: Identify where visitors leak out of your funnel
- Conversion pages: Optimize the user journey on product or sign-up pages
- Pricing Pages
- Blog & Content Pages
- Checkout Pages
- Homepage
Step 2: Master Microsoft Clarity Heatmaps
Click heatmaps are like X-ray vision for your website. They reveal:
- Whether users engage with your primary CTA
- Which elements draw the most attention
- Unexpected click patterns that might surprise you
- Navigation Behavior
- Distractions or Misleading Elements
- Content Engagement
- Conversion Bottlenecks
Scroll heatmaps show you the harsh truth about content consumption:
- How far users scroll (spoiler: not as far as you think)
- Where engagement drops off
- Whether important content is buried too deep
- Above-the-Fold Performance
Step 3: Dive Deep with Session Recordings
This is where things get interesting. Microsoft Clarity session recordings allow you to observe real users navigating your site, as if you’re watching them through a one-way mirror.
Focus on sessions with:
- Short durations (bounce sessions)
- Rage clicks (signs of user frustration)
- Device-specific issues (mobile pain points)
I once watched a session recording where a user clicked the same non-clickable image fourteen times. Fourteen! That’s not user error—that’s design error.
Step 4: Address Drop-Off Points
Use scroll depth insights to identify where users lose interest. Common solutions include:
- Adding interactive elements to maintain engagement
- Breaking up dense text with subheaders and white space
- Repositioning important content higher on the page
- Creating compelling section hooks that encourage continued scrolling
- Identifying if CTAs, pricing tables, or forms are placed too low to be seen by most visitors
- Suggesting where to reposition high-value elements for better conversions
Step 5: Optimize Based on User Behavior Analytics
Transform dead clicks into meaningful interactions:
- Make non-clickable elements that receive clicks clickable.
- Simplify confusing navigation elements.
- Reduce form friction that causes abandonment.
- Enhance mobile user experience based on device-specific recordings.
Use Case Adaptation: Tailor Clarity Insights to Your Business Type
- E-commerce Sites: Focus on product pages and checkout flows. Use rage click data to uncover broken elements or pricing confusion.
- Service-Based Businesses: Analyze form pages and service descriptions to ensure consistency and accuracy. Scroll maps help ensure your key differentiators are seen.
- Content Publishers: Prioritize scroll heatmaps on blog posts to adjust the placement of CTAs and internal links.
- Mobile-First Users: Utilize device filtering in session recordings to address mobile UX pain points, including tap targets and menu visibility.
- Lead-generation sites
Integration Superpowers: Clarity + Your Existing Tools
Clarity integration with Google Analytics creates a powerful duo:
| Tool | Primary Function | Best Used For |
| Google Analytics 4 | Traffic and conversion metrics | Understanding what happened |
| Microsoft Clarity | User behavior insights | Understanding why it happened |
| Google Search Console | Search performance data | Identifying high-impression, low-engagement pages |
Combine these insights for maximum impact. For example, use Search Console to identify pages with high impressions but low click-through rates, then use Clarity to understand user behavior once they arrive.
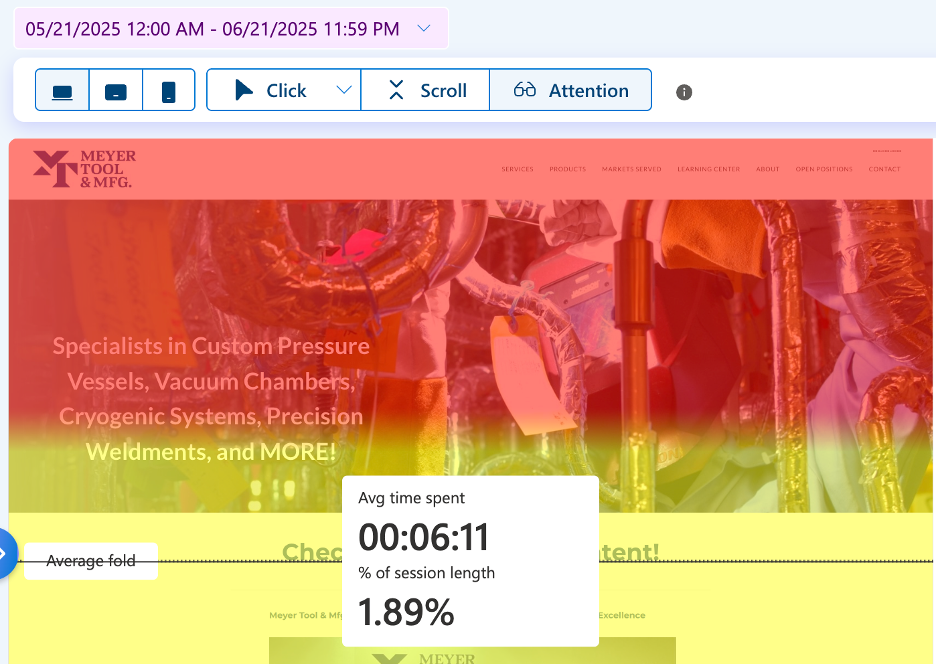
Real-World Success Story
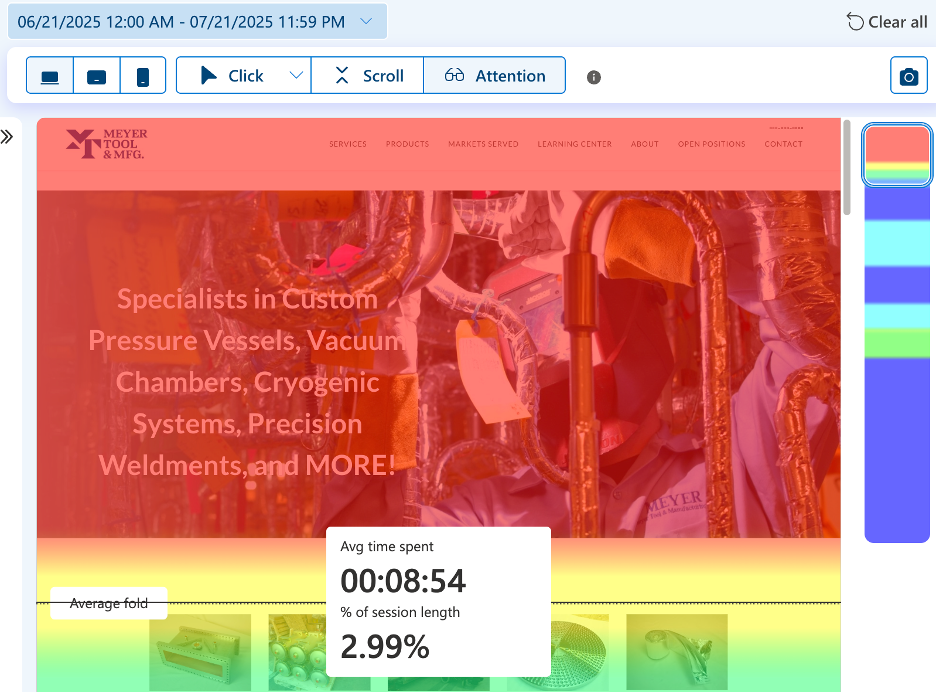
A manufacturing website was seeing a lack of activity below the fold. After shortening the height of the hero image and pulling up a block of image-based product offerings to replace a text section below the fold section:
- Average time spent below the fold increased from 6:11 seconds to 8:54 seconds
- Session length increased from 1.89% to 2.99%
- New users increased by 68%
- Key events (conversions) increased by 50% on the product pages, resulting in a corresponding 30% decline in their bounce rate
And why does this matter? Because better usage performance like increased session length and decreased bounce rates helps pages rank better in Google, all else being equal.
Performance and Privacy: The Technical Stuff Made Simple
Performance impact: Clarity’s script is lightweight and loads asynchronously, so it won’t slow down your site.
Privacy compliance: Clarity automatically masks sensitive information and complies with GDPR and CCPA requirements out of the box.
Review frequency: Check key pages monthly, new optimizations weekly.
The Bottom Line: UX as Your SEO Secret Weapon
With AI-driven search, a positive user experience is essential for SEO success. Google’s algorithms increasingly reward sites that provide excellent user experiences, making tools like Microsoft Clarity invaluable for SEO for SMBs.
Website user behavior analytics, provided by Clarity, give you the insights needed to create experiences that both users and search engines love. It’s like having a focus group running 24/7 on your website, except your participants are real customers with real problems to solve.
The beauty of Clarity lies in its simplicity. You don’t need a PhD in data science to understand that rage clicks are bad or that users abandoning forms halfway through indicates friction.
Frequently Asked Questions About Microsoft Clarity
Is Microsoft Clarity free?
Yes, completely free with no hidden costs or usage limits.
How does Microsoft Clarity work?
It uses lightweight JavaScript to track user interactions, then processes this data to create heatmaps and session recordings.
What does Clarity help with?
Clarity helps identify UX issues, optimize conversion paths, and understand user behavior patterns that impact SEO performance.
How accurate is Microsoft Clarity data?
Very accurate for behavioral insights, although it focuses on user actions rather than traditional metrics, such as demographics.
Does Microsoft Clarity record all sessions?
Clarity intelligently samples sessions to provide representative data without overwhelming you with information.
Ready to Transform Your Website’s Performance?
Microsoft Clarity isn’t just another analytics tool—it’s your bridge between data and understanding, between metrics and meaningful improvements. In a world where every click, scroll, and interaction tells a story, Clarity helps you become fluent in the language your users are already speaking.
Start small, focus on your most important pages, and let user behavior guide your optimization strategy. Your bounce rate (and your bottom line) will thank you.
Ready to see what your users are doing on your website? Set up Microsoft Clarity today and uncover the insights that are hiding in plain sight. Your future self—and your conversion rates—will appreciate the investment.
At OpenMoves, we combine behavioral analytics with data-driven SEO to determine why visitors bounce and how to enhance their experience.
Contact us today to transform user behavior into higher rankings and increased conversions.